In this project we investigated predictability of electricity prices in the Canadian provinces of Alberta and Ontario, as well as in the US Mid-C market. Using scale-dependent detrended fluctuation analysis, spectral analysis, and the probability distributionanalysis we showed that the studied markets exhibit strongly anti-persistent properties suggesting that their dynamics can be predicted based on historic price records across the range of time scales from one hour to one month. For both Canadian markets, the price movements reveal three types of correlated behavior which can be used for forecasting. The discovered scenarios remain the same on different time scales up to one month as well as for on- and off- peak electricity data. These scenarios represent sharp increases of prices and are not present in the Mid-C market due to its lower volatility. We argue that extreme price movements in this market should follow the same tendency as the more volatile Canadian markets. The estimated values of the Pareto indices suggest that the prediction of these events can be statistically stable. The results obtained provide new relevant information for managing financial risks associated with the dynamics of electricity derivatives over time frame exceeding one day.
Uritskaya O.Y., Uritsky V.М. Predictability of price movements in deregulated electricity markets // Energy Economics, Volume 49, May 2015, Pages 72–81
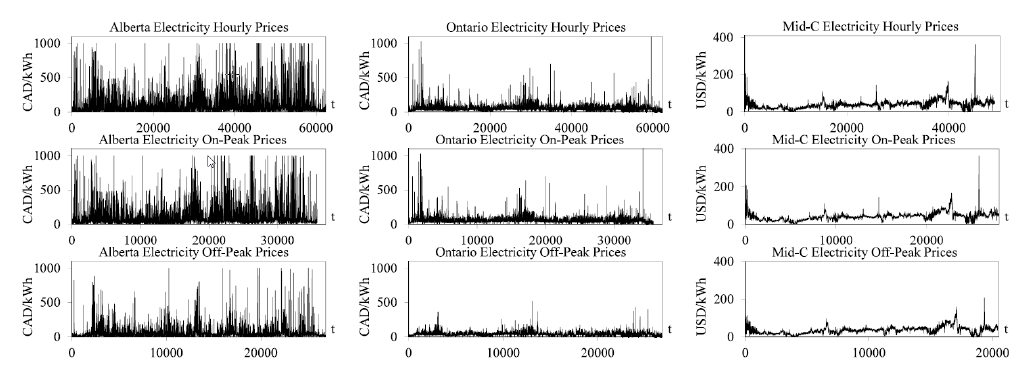
Fig.1. Time series of hourly electricity prices in Alberta (left), Ontario (center) and Mid-C (right) markets. Fromtop to bottom: all hourly prices, on-peak prices, and off-peak prices. Alberta electricity prices demonstrate significantly higher fluctuations than those in Ontariomarket, plotted on the same vertical scale. Fluctuations of electricity prices in Mid-C have twice as low amplitude as that in Ontario, and about 5 times smaller than in Alberta. 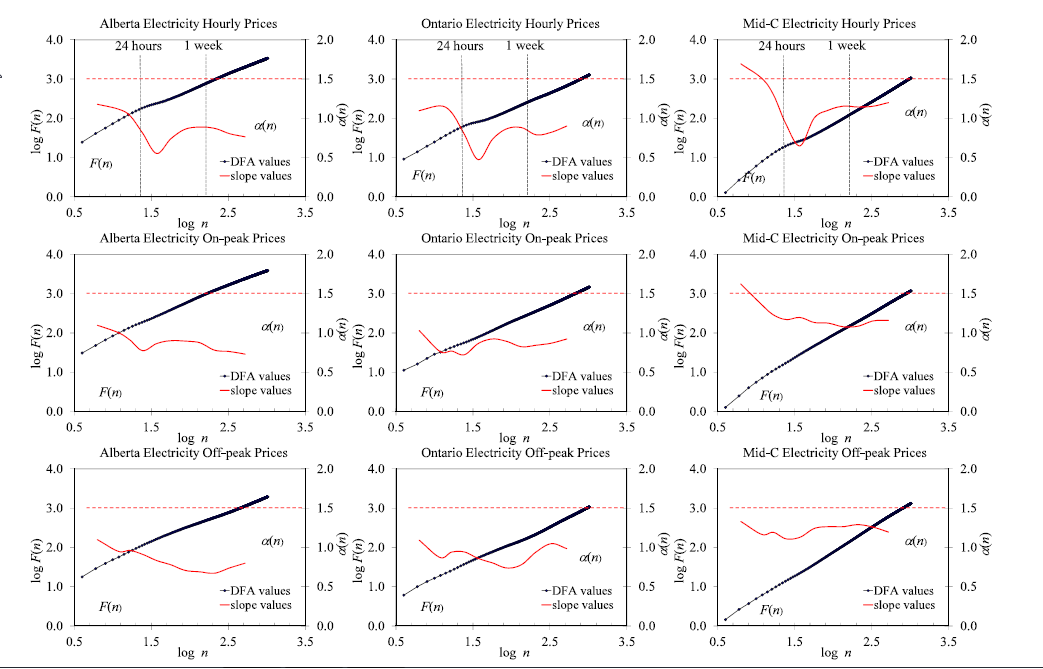
Fig.2. Dependence of the detrended variation F and the local scale-dependent DFA slope α on the time scale n for all hourly, on- and off-peak electricity prices in Alberta (left), Ontario (center), and Mid-C (right) markets. The presented statistics reveal complex correlated structure of price movements with quasi-periodic components associated with daily and weekly cycles. In all presented data sets the scale-dependent DFA exponent is significantly below the level 1.5 defining the state of informational efficiency,which provides an opportunity of forecasting the prices over wide ranges of time scales.

Fig.3. Diagrams of aggregated price movements for several time scales n ranging from 1 to 720 h. Most of the plots have a distinctly asymmetric shape reflecting a casual relationship between the pricemovements. For the Alberta and Ontario plots (first and second columns), the asymmetry of the cloud of points assumes anti-persistent dependence which can be used for price forecasting. The Mid-C diagrams (third column) take a different formdepending on the aggregation scale,with the persistent and anti-persistent tendencies found at n=1 and n = 12, correspondingly.